答案
Top N filters are calculated before other dimensional filters. For more information, see Tableau's Order of Operations.
To display the average sales of all sub-categories as a reference line on a bar chart that is showing the top 5 average sales in each sub-category, follow the steps below:
Option 1:
Use a FIXED LOD.
In this case, the FIXED LOD is processed simultaneously with the TOP N filter. The calculation results are not affected by dimension and measure filters due to the order of operations.
1. Select Analysis > Create Calculated Field. Name the field Fixed and enter the following calculation then click OK:
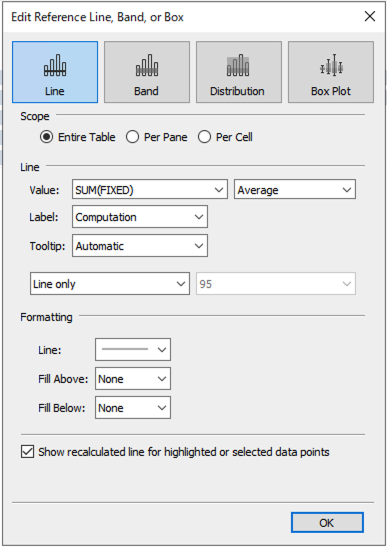
{ FIXED : AVG([Sales]) }
2. Drag Fixed to Detail on the Marks card.
3. Drag Reference Line from the Analytics pane into the view and drop it to the Table destination.
4. Change Value in the Edit Reference Line, Band, or Box dialog as follows.
Option 2
Use EXCLUDE LOD.
EXCLUDE LOD is processed after the TOP N filter. Therefore, it is necessary to use a measure filter such as INDEX to display the top N data, rather than the TOP N filter.
In this case, other dimension filters can be reflected in the calculation results.
1. Follow the instructions in the Finding the Top N Within a Category article to use INDEX() as a top N filter.
2. Select Analysis > Create Calculated Field. Name the field Exclude and enter the following calculation then click OK:
{ EXCLUDE [Sub-Category] : AVG([Sales]) }
3. Drag the Exclude field to Detail on the Marks card.
4. Drag Reference Line from the Analytics pane into the view and drop it to the Table destination.
5. Change Value in the Edit Reference Line, Band, or Box dialog as follows.
