問題
How to show data for the current month, the previous month, and the same month of the previous year on a single graph?
How to show data for the current month, the previous month, and the same month of the previous year on a single graph?
Follow along to review the steps contained using the packaged sample workbook found in the Attachments section of this article.
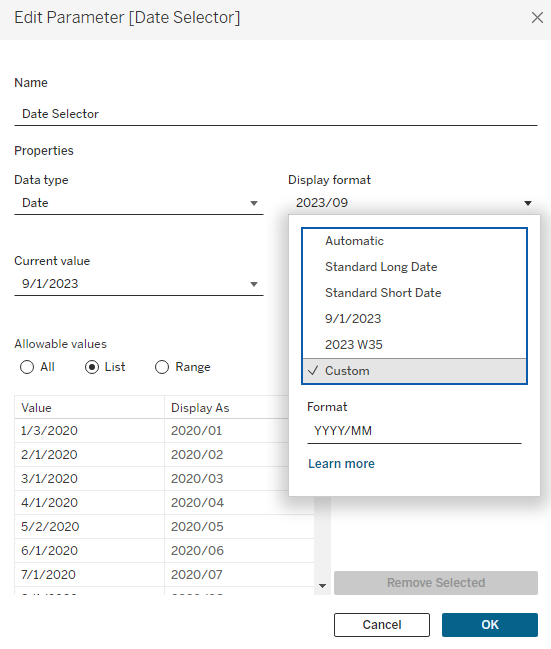
1. Create a parameter called Date Selector as demonstrated below.
2. Create a calculation field called Filter with the following calculation, to filter out data of the current year and the previous year.
DATEPART('month', [Order Date])=DATEPART('month', [Date Selector])
and
(DATEPART('year', [Order Date])=DATEPART('year', [Date Selector])-1 or DATEPART('year', [Order Date])=DATEPART('year', [Date Selector]))
3. Create a calculation field called Current Month, to calculate the sales of the current month.
if DATEDIFF('month',[Date Selector],[Order Date]) = 0 THEN [Sales] END
4. Create a calculation field called Previous Month, to calculate the sales of the previous month.
{fixed DATEPART('day', [Order Date]):sum(
    if DATEDIFF('month',[Date Selector],[Order Date]) = -1 THEN [Sales] END
)}
5. Create a calculation field called Same Month Previous Year, to calculate the sales of the same month from a previous year.
{fixed DATEPART('month', [Order Date]),DATEPART('day', [Order Date]):sum(
        if DATEDIFF('year',[Date Selector],[Order Date]) = -1 THEN [Sales] END
)}
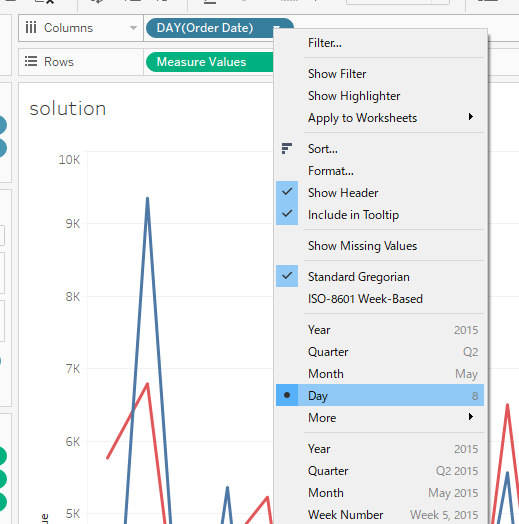
6. Add Order Date to Columns then right-click DAY(Order Date) to select the first Day.
7. Right-click DAY(Order Date) again, then select Continuous.
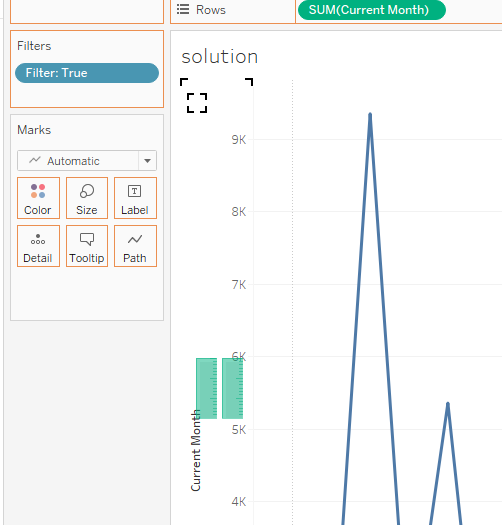
8. Add Current Month to Rows.
9. Drag Previous Month to the left axis as demonstrated below and drop.
10. Add Same Month Previous Year to the axis using the same method example above.